Infographics and social posts
Infographics and social media posts have been created for you to download and share. These support many of our GLAM Study Top Tips and can help you spread the word about the value of GLAMs.
Click here to download infographics.
Click here to download social post graphics.
Infographics
We have developed general, as well as sector-specific, infographics to distill and present the study findings in an eye-catching way. Perfect for adding to a web page or printing and posting in a common space at your GLAM.
Download all of the toolkit infographics 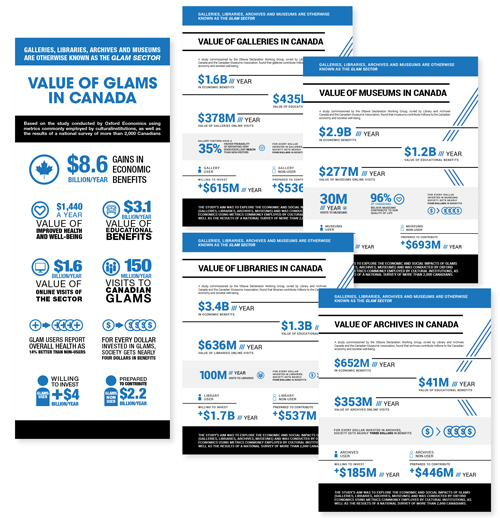
Social posts
See GLAM Study Top Tips, Tip #1: Share #GLAMFacts on social media.
Social media posts have been created in graphic form for you to download and share on any social media platform. Remember to hyperlink to the study and to make use the #GLAMFact hashtag!
Download all of the social media #GLAMFacts visuals 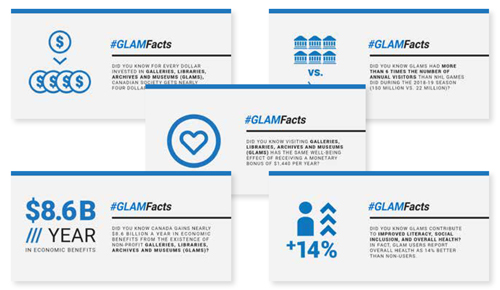
- Did you know Canada gains nearly $8.6 billion a year in economic benefits from the existence of non-profit galleries, libraries, archives and museums (GLAMs)? It’s true: bit.ly/GLAMs #GLAMFacts
- Did you know for every dollar invested in galleries, libraries, archives and museums (GLAMs), Canadian society gets nearly four dollars in benefits? It’s true: bit.ly/GLAMs #GLAMFacts
- Did you know visiting galleries, libraries, archives and museums (GLAMs) has the same well-being effect of receiving a monetary bonus of $1,440 per year? It’s true: bit.ly/GLAMs #GLAMFacts
- Did you know GLAMs contribute to improved literacy, social inclusion and overall health? GLAM users report overall health as 14% better than non-users. It’s true: bit.ly/GLAMs #GLAMFacts
- Did you know GLAMs had more than 6 times the number of annual visitors than NHL games did during the 2018-19 season (150 million vs. 22 million)? It’s true: bit.ly/GLAMs #GLAMFacts